
Career-focused analytics · BI · Applied machine learning
AI Data Analyst
Build the skills, portfolio and interview confidence to compete for data roles.
Train across Excel, SQL, Python, Power BI and applied machine learning through 12 employer-relevant projects and structured career preparation.
₹35,999
inclusive of GST
MRP ₹59,999
You save ₹24,000 (40% off)EMI starting from ₹4,000/month. Eligibility and terms apply.
Course fit
A serious path into modern analytics roles
Start with spreadsheet familiarity, then build the coding, analytical judgment, dashboards and predictive-model experience expected in practical data work.
- Starting level
- Basic spreadsheet familiarity is useful.
- Coding
- No previous Python, SQL or machine-learning experience is required.
- Quantitative foundation
- Comfort with numbers, charts and structured problem-solving is expected; the required statistics and model intuition are developed in the programme.
- Laptop
- A Windows-capable laptop is recommended for Power BI Desktop, Python and local ML workflows.
- Practice
- Plan six to eight hours per week outside live classes during the Python, SQL and ML phases.
Applied machine learning
Move from analysis to responsible prediction
Build on data preparation, Python and applied statistics to train, compare and explain machine-learning models for practical business problems.
Statistics and model intuition are developed alongside hands-on modelling, with consistent quantitative practice expected.
What employers expect
Learn the work, not just the tools
Develop the end-to-end capability to frame a business question, prepare reliable data, analyse it, build decision-ready dashboards, train predictive models and defend your conclusions.
Your next career move
Build from where you are. Prepare for where you want to go.
No previous Python, SQL or machine-learning experience is required. The programme builds progressively, with regular hands-on practice between sessions.
Career opportunities
Career paths this programme prepares you to pursue
Target analytics and BI opportunities across marketing, sales, operations, finance, customer intelligence and technology, with pathways into applied ML and data science.
- Data Analyst / Junior Data Analyst
- AI Data Analyst
- Business Data Analyst
- BI / Power BI Analyst
- Reporting / MIS Analyst
- SQL Data Analyst
- Data Visualisation Analyst
- Analytics Associate
- Marketing / Sales / Operations Data Analyst
- Customer Insights / CRM / Retail Analytics Analyst
- Predictive Analytics Analyst
- Product Data Analyst
- Decision Science Analyst
- Machine Learning / AI-ML Analyst
- Junior / Associate Data Scientist
- Junior AI/ML Engineer
- Junior Machine Learning Engineer
Your profile assessment helps identify the strongest first targets for your background and the capability gaps to close next.
Your job-ready portfolio
Graduate with proof of what you can do
When an interviewer asks what you can do, answer with documented work that shows how you think, build, validate and communicate.
Select, refine and document your strongest builds as portfolio case studies that make the problem, method, evidence and recommendation easy to understand.
From course to career
Turn your learning into a focused job search
Structured career preparation helps you choose realistic roles, present your strongest evidence and walk into interviews ready to explain your work.
- 1
Profile and role assessment
Map your education, experience, current skills and career objective to the roles that offer the strongest fit.
- 2
Resume building
Turn your experience and course projects into concise, outcome-focused resume points for your target roles.
- 3
Portfolio building
Shape your strongest builds into case studies that make your problem-solving and technical capability easy to assess.
- 4
Interview preparation
Practise your project walkthroughs, technical decisions, business recommendations and role-relevant interview questions.
You leave with a clearer target-role strategy, stronger application material and a practised interview story.
Career growth potential
See how earning potential grows with skills and experience
Use your experience band to explore blended India-market benchmarks across analytics, business intelligence and applied-ML roles.
- Market median
- ₹5.5 LPA
- Typical average
- ₹6.5 LPA
- Earning range
- ₹3-12 LPA+
- Market median
- ₹12 LPA
- Typical average
- ₹13.5 LPA
- Earning range
- ₹7-24 LPA+
- Market median
- ₹21 LPA
- Typical average
- ₹24 LPA
- Earning range
- ₹12-40 LPA+
Blended India-market benchmarks across the career paths shown above; reviewed September 2026.
Actual compensation varies by role, employer, location, experience and demonstrated capability.
Your project portfolio
Build the work you will discuss in interviews
Complete 12 guided, employer-relevant workflows using datasets, queries, notebooks, dashboards and predictive models. Refine your strongest work into clear portfolio case studies.
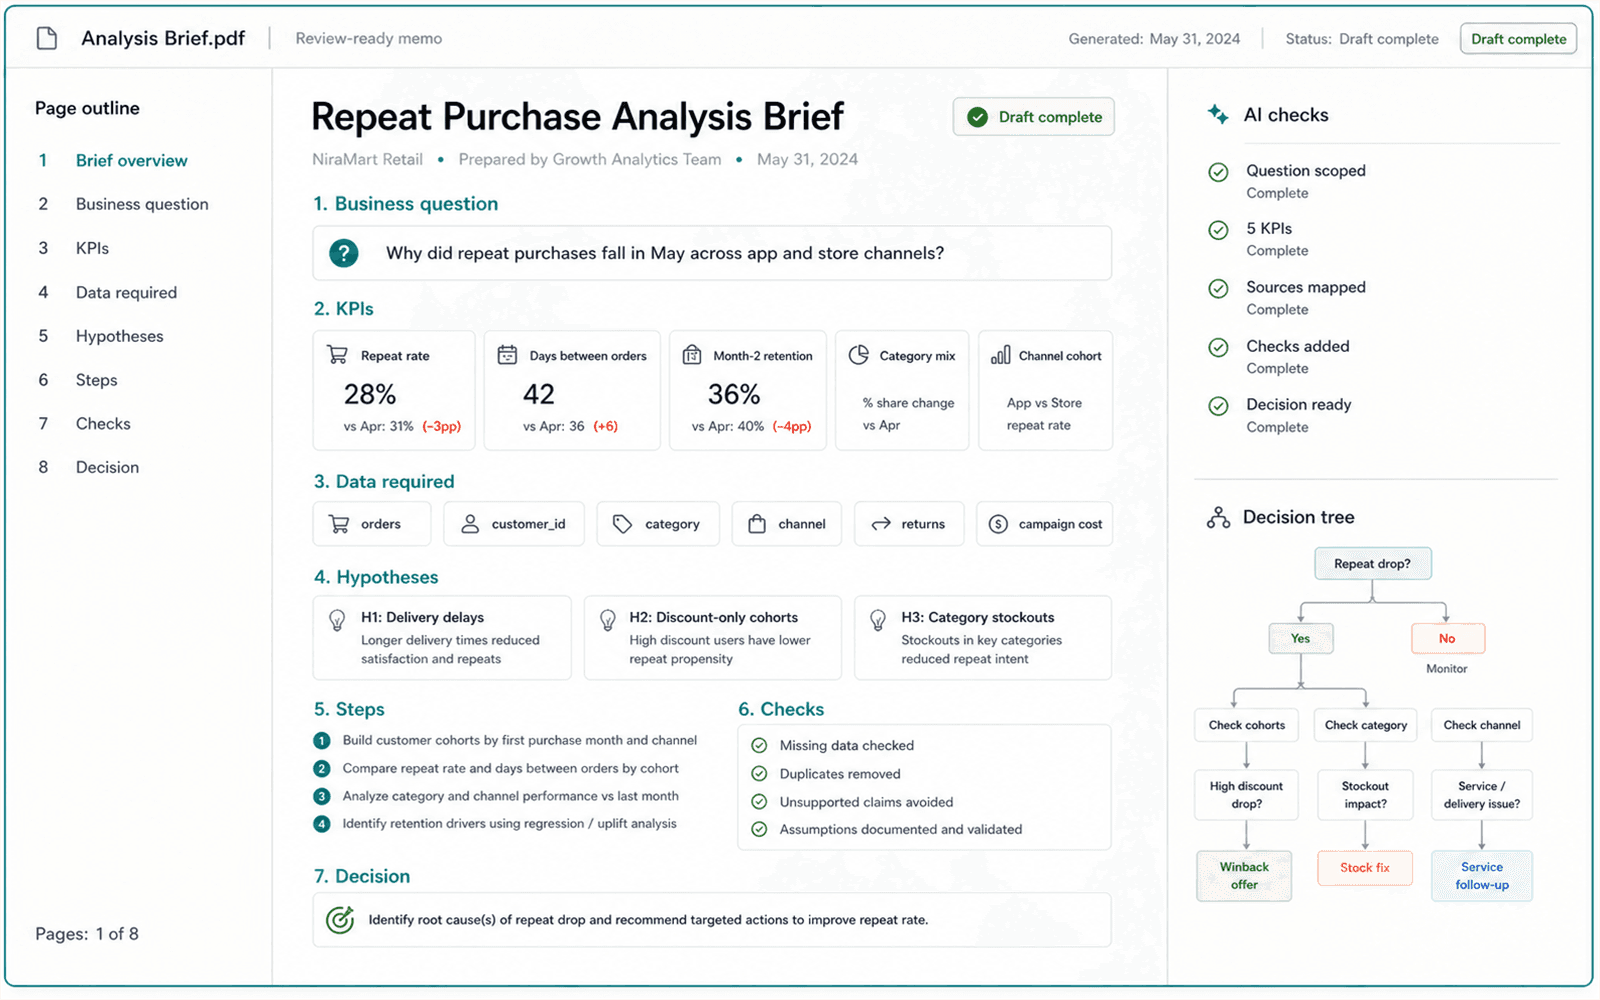
You leave with: A reusable analysis brief with verification checkpoints.
Illustrative project output. Interfaces and platform versions may change.
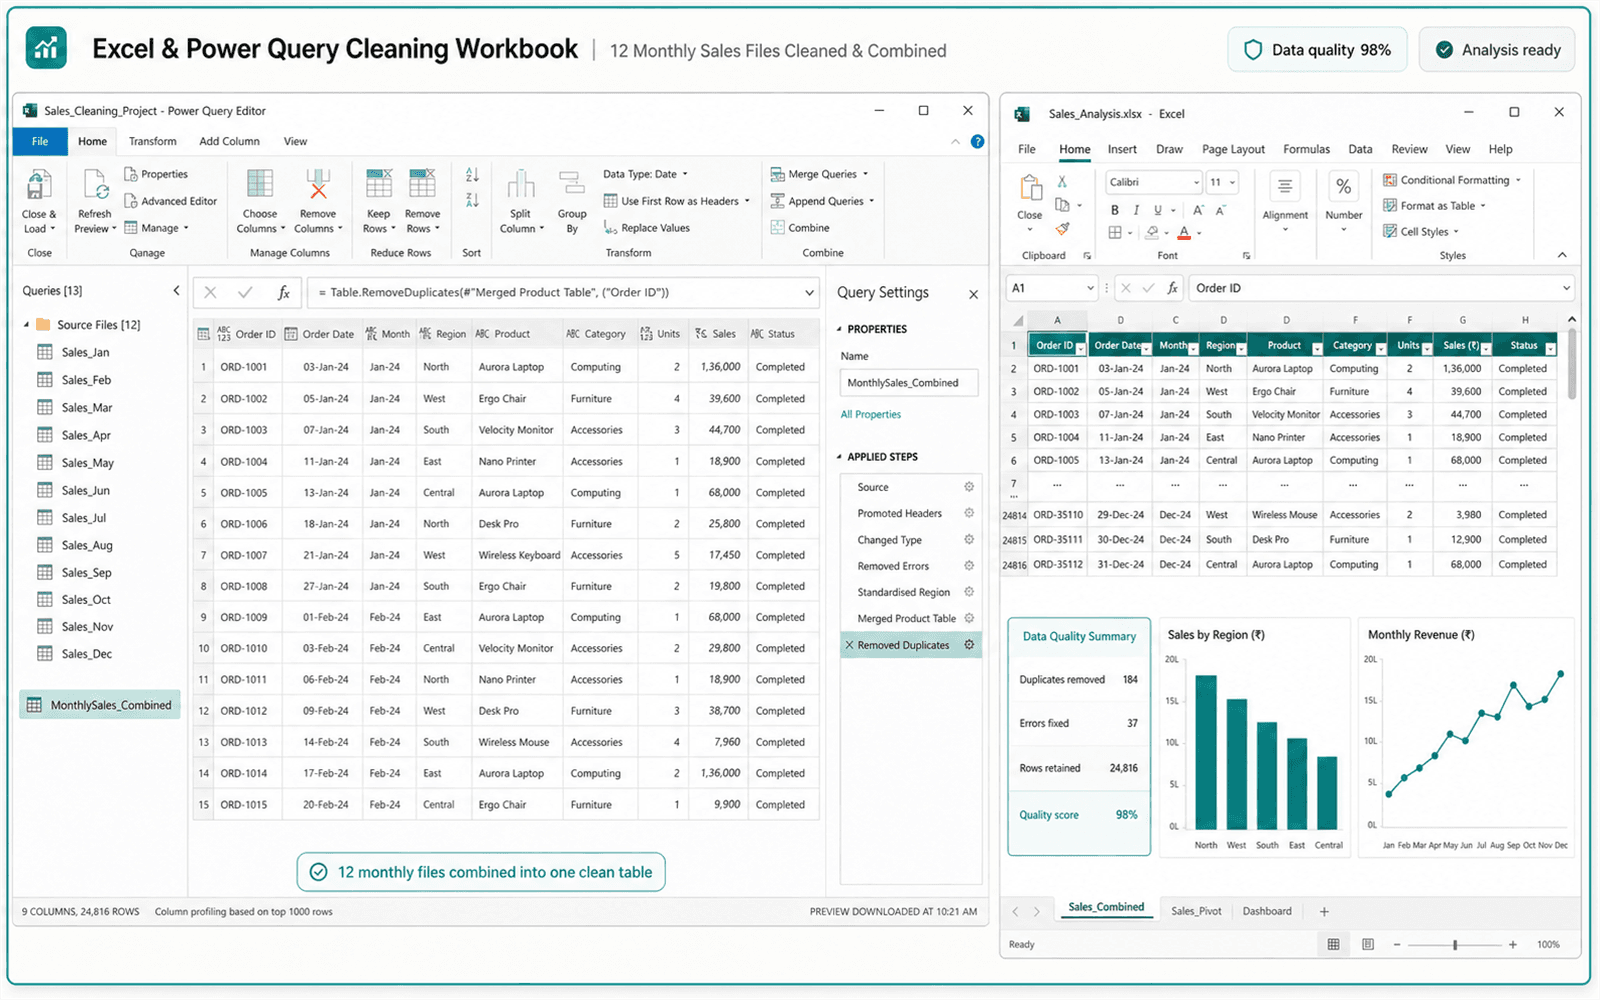
You leave with: An analysis-ready workbook with a documented cleaning trail.
Illustrative project output. Interfaces and platform versions may change.

You leave with: A shared tracker that turns live data into decisions.
Illustrative project output. Interfaces and platform versions may change.
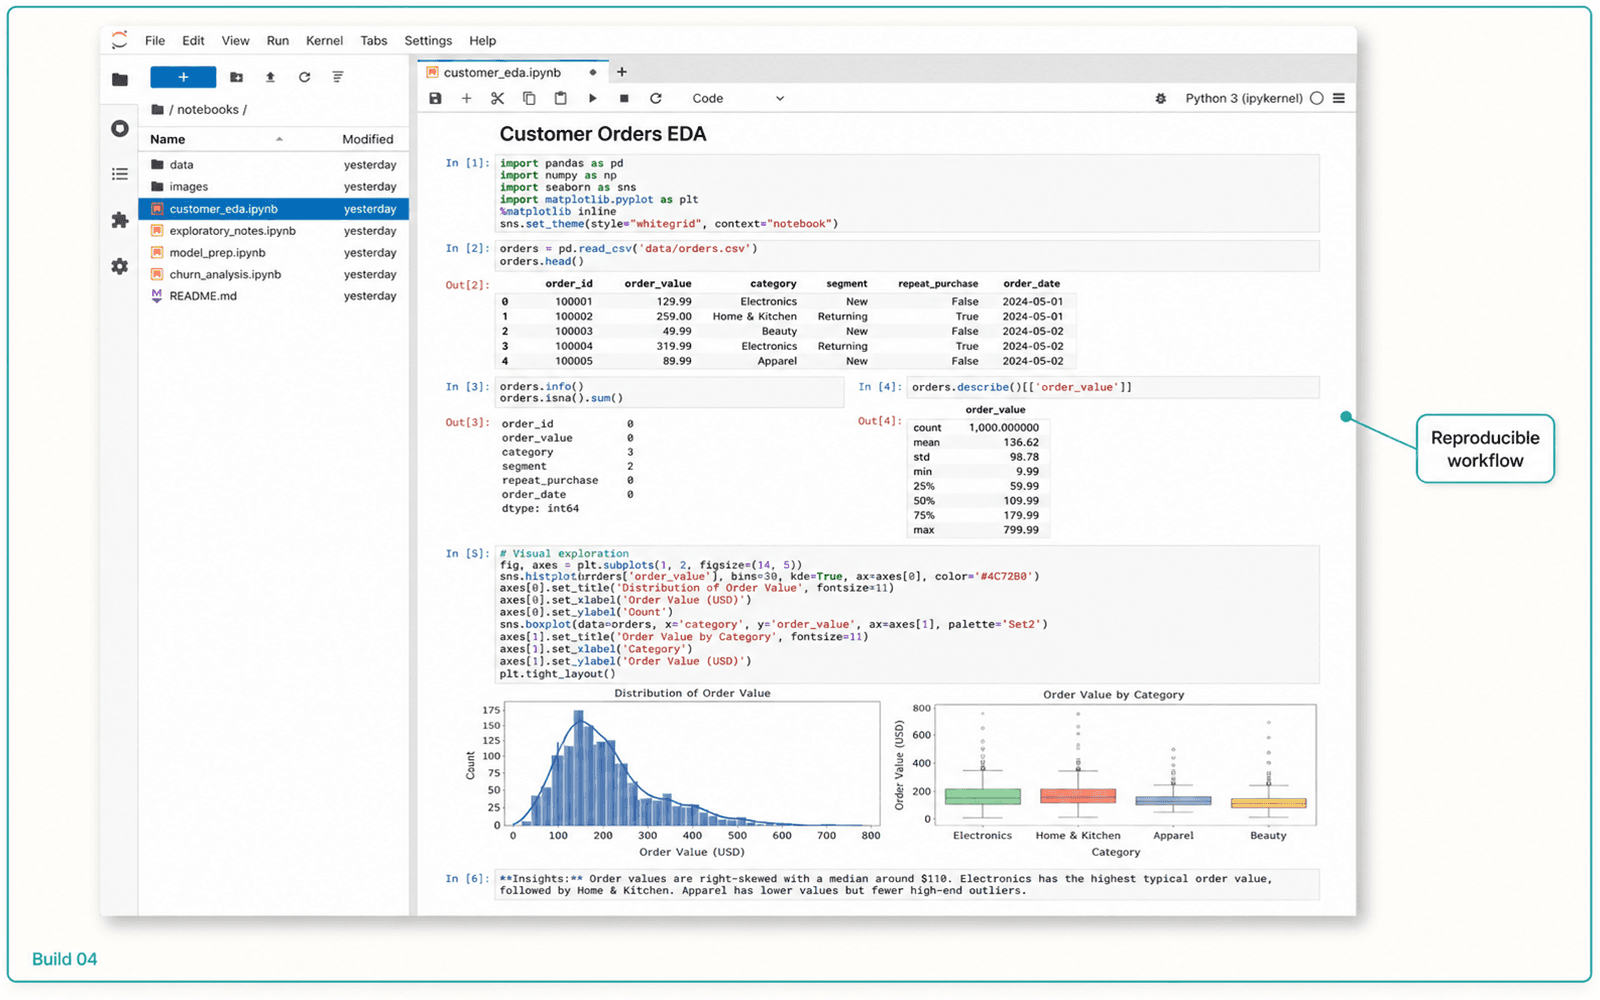
You leave with: A reproducible notebook with evidence, caveats and recommendations.
Illustrative project output. Interfaces and platform versions may change.
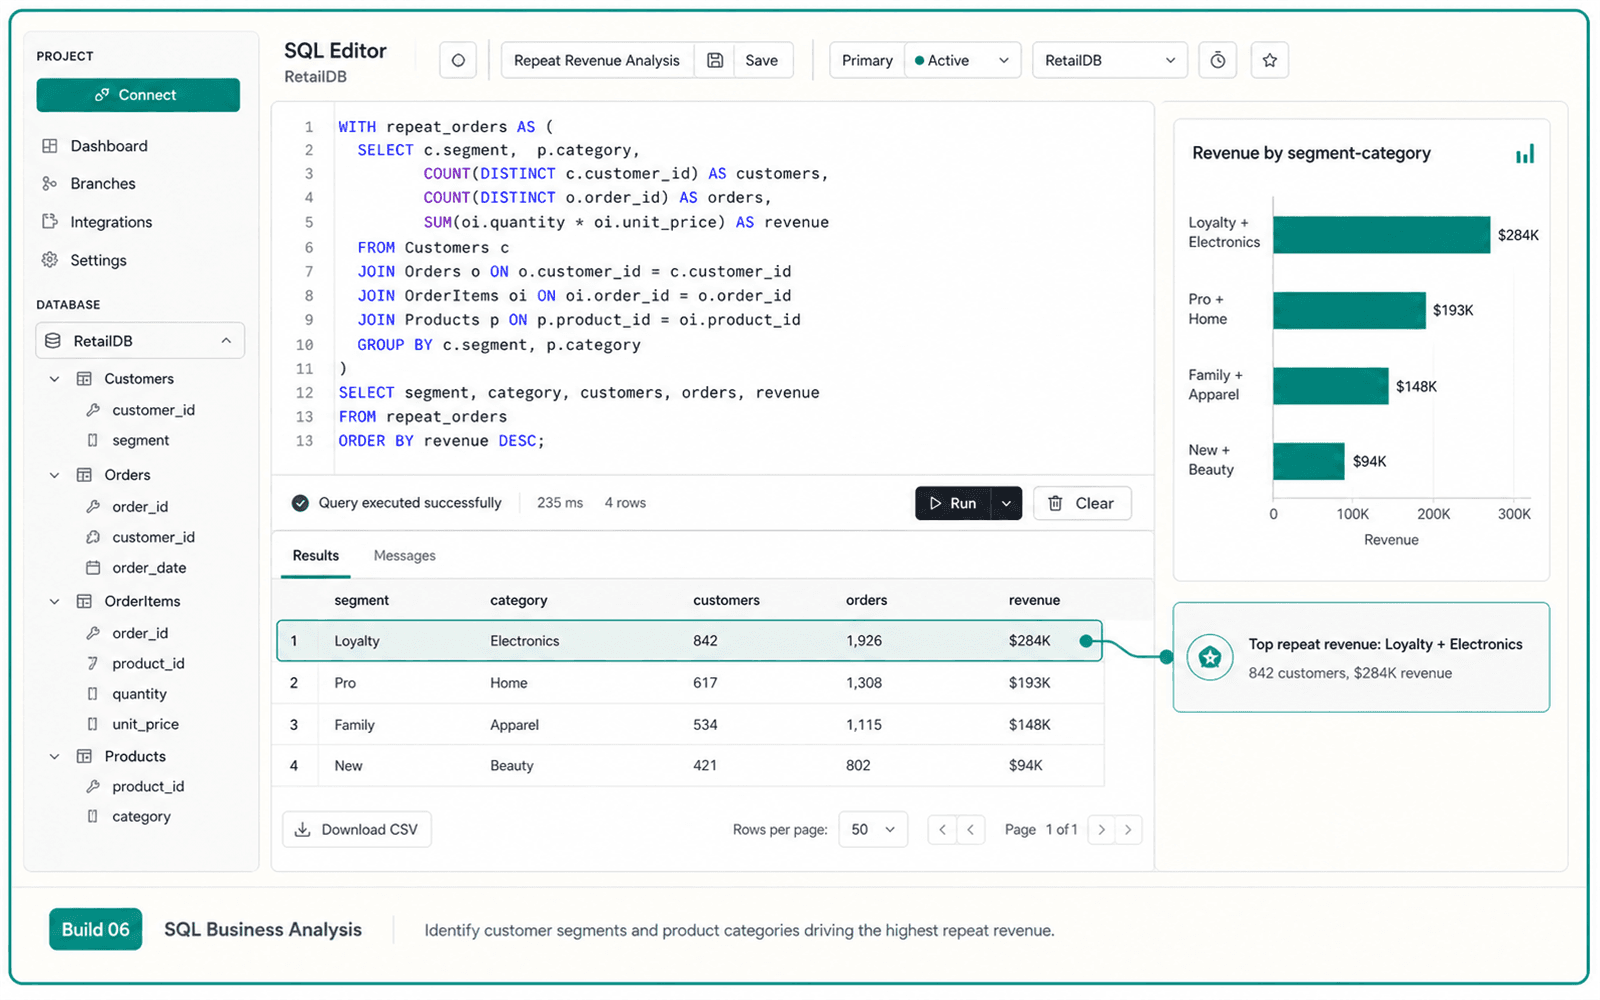
You leave with: A documented query set that answers business questions.
Illustrative project output. Interfaces and platform versions may change.
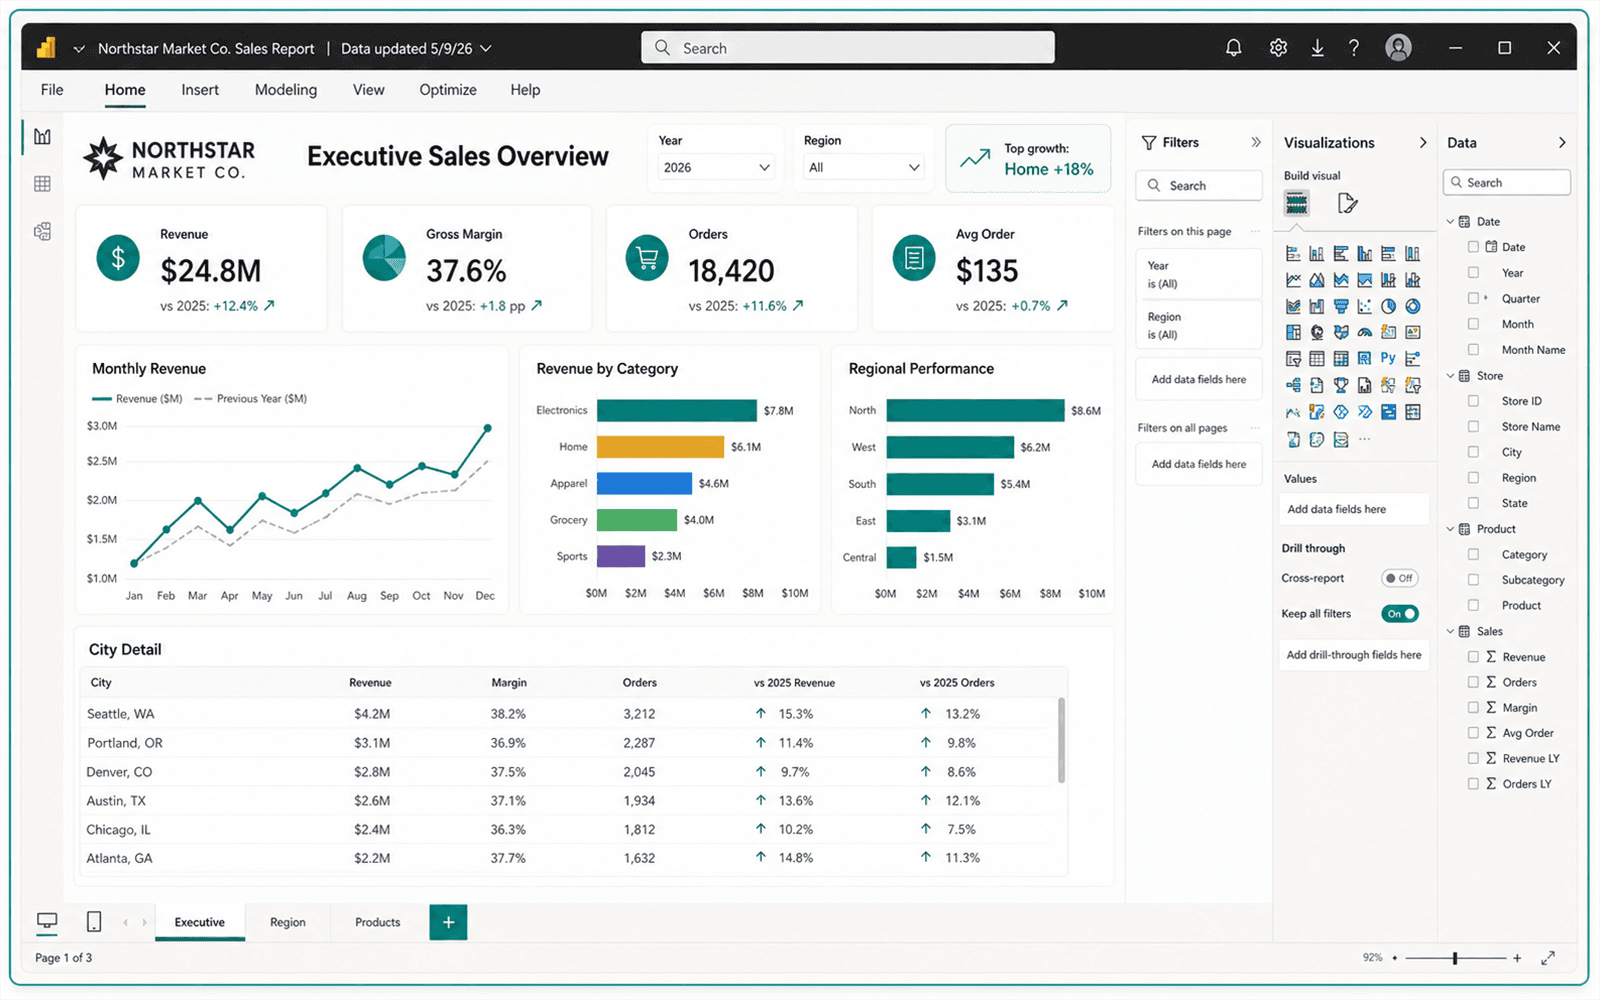
You leave with: An executive dashboard organised around decisions.
Illustrative project output. Interfaces and platform versions may change.
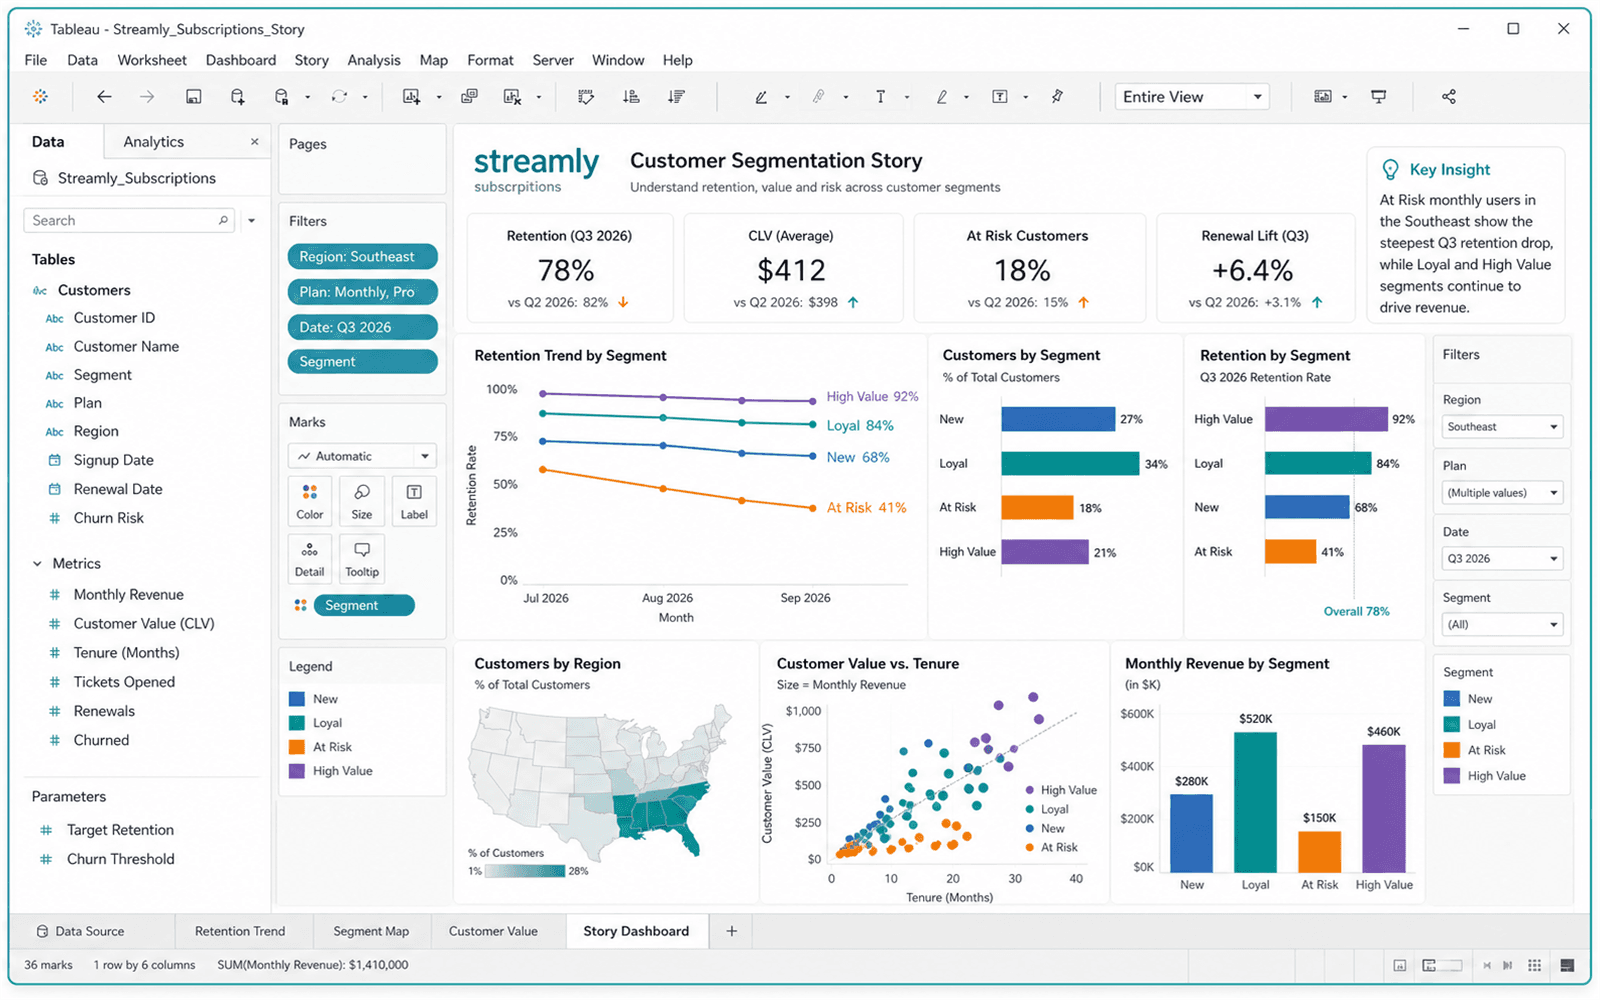
You leave with: A visual explanation of a finding and its implication.
Illustrative project output. Interfaces and platform versions may change.
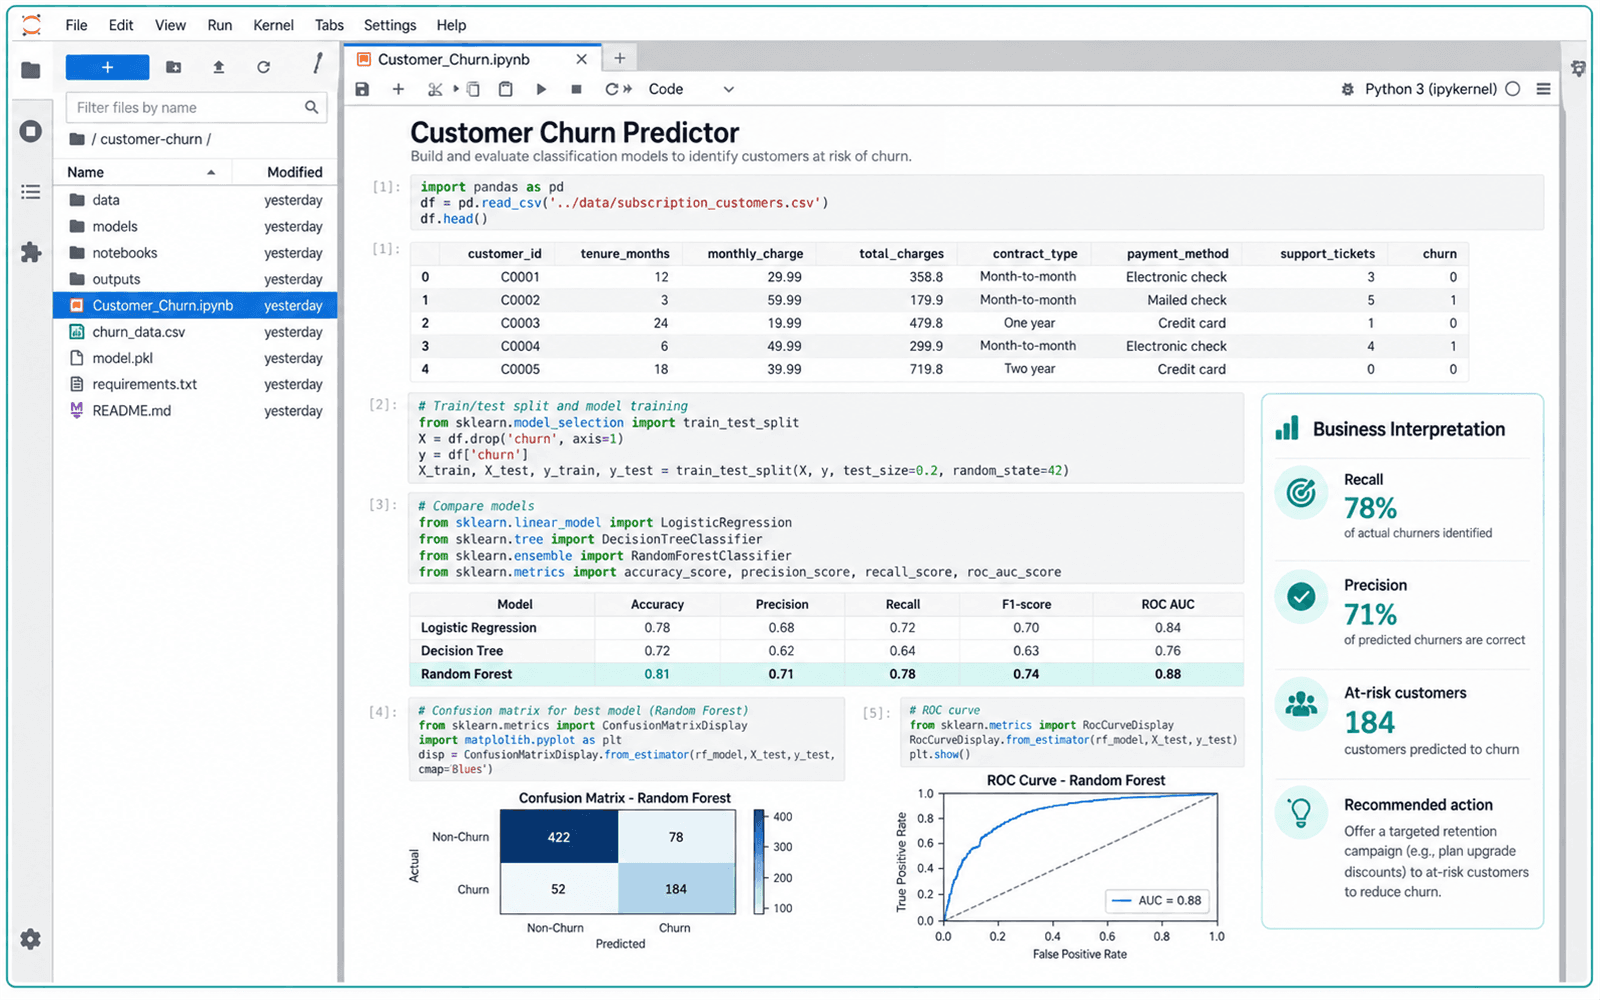
You leave with: A classification workflow that connects prediction to retention action.
Illustrative project output. Interfaces and platform versions may change.
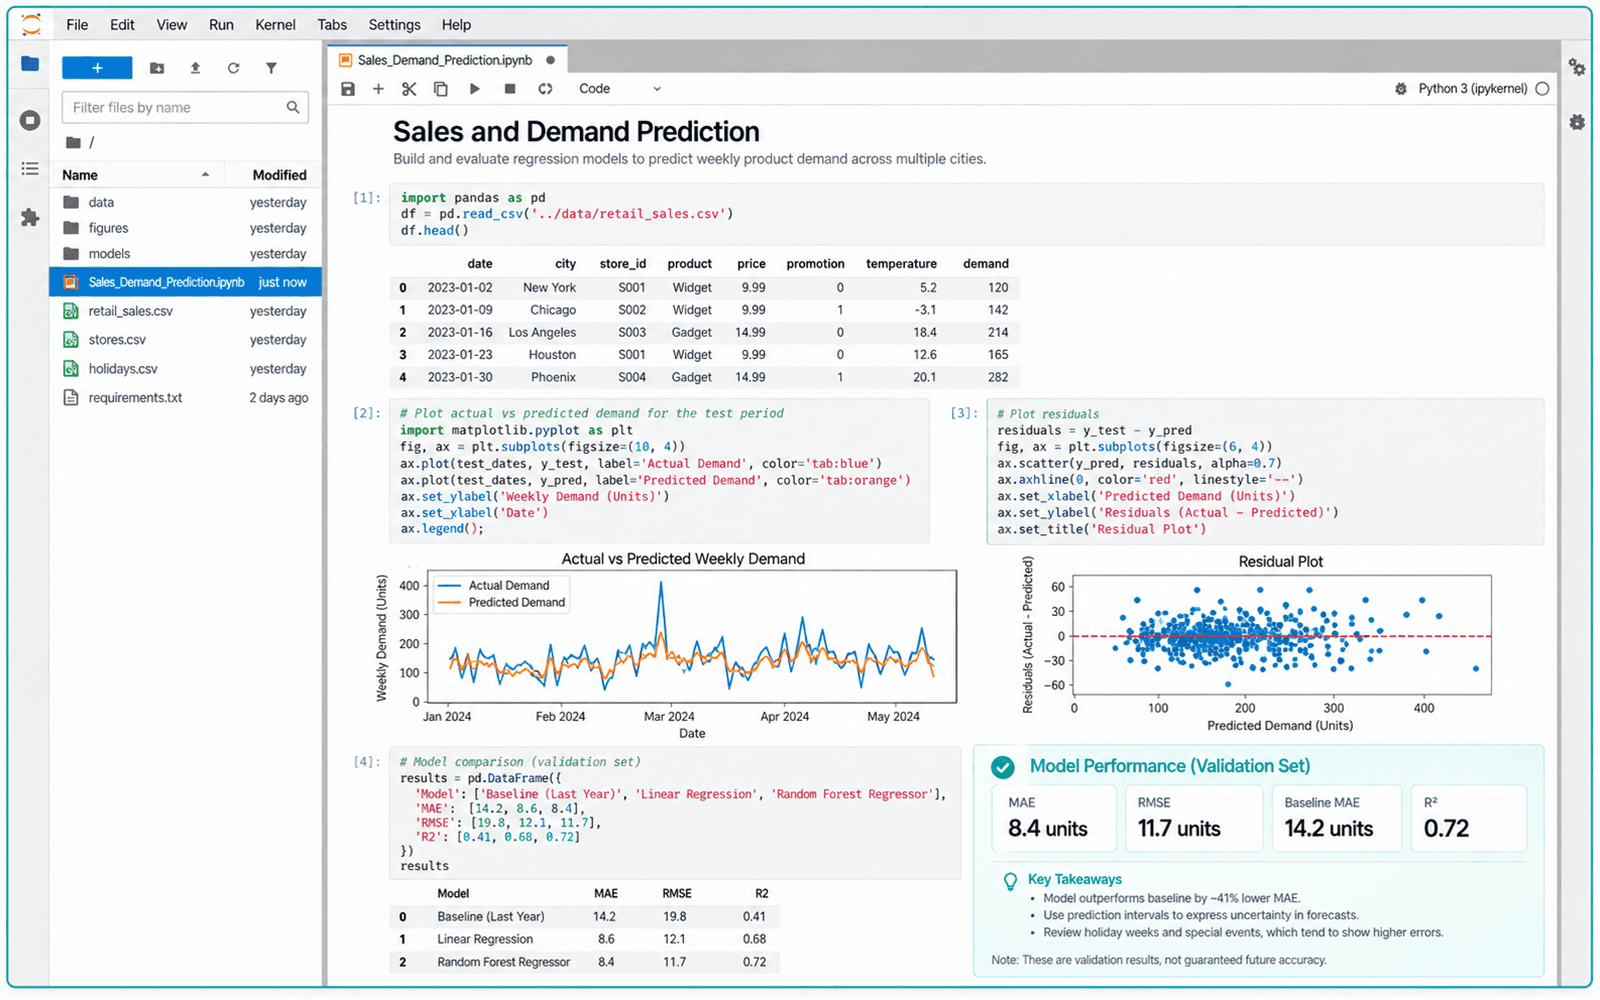
You leave with: A defensible prediction workflow using business-appropriate regression metrics.
Illustrative project output. Interfaces and platform versions may change.
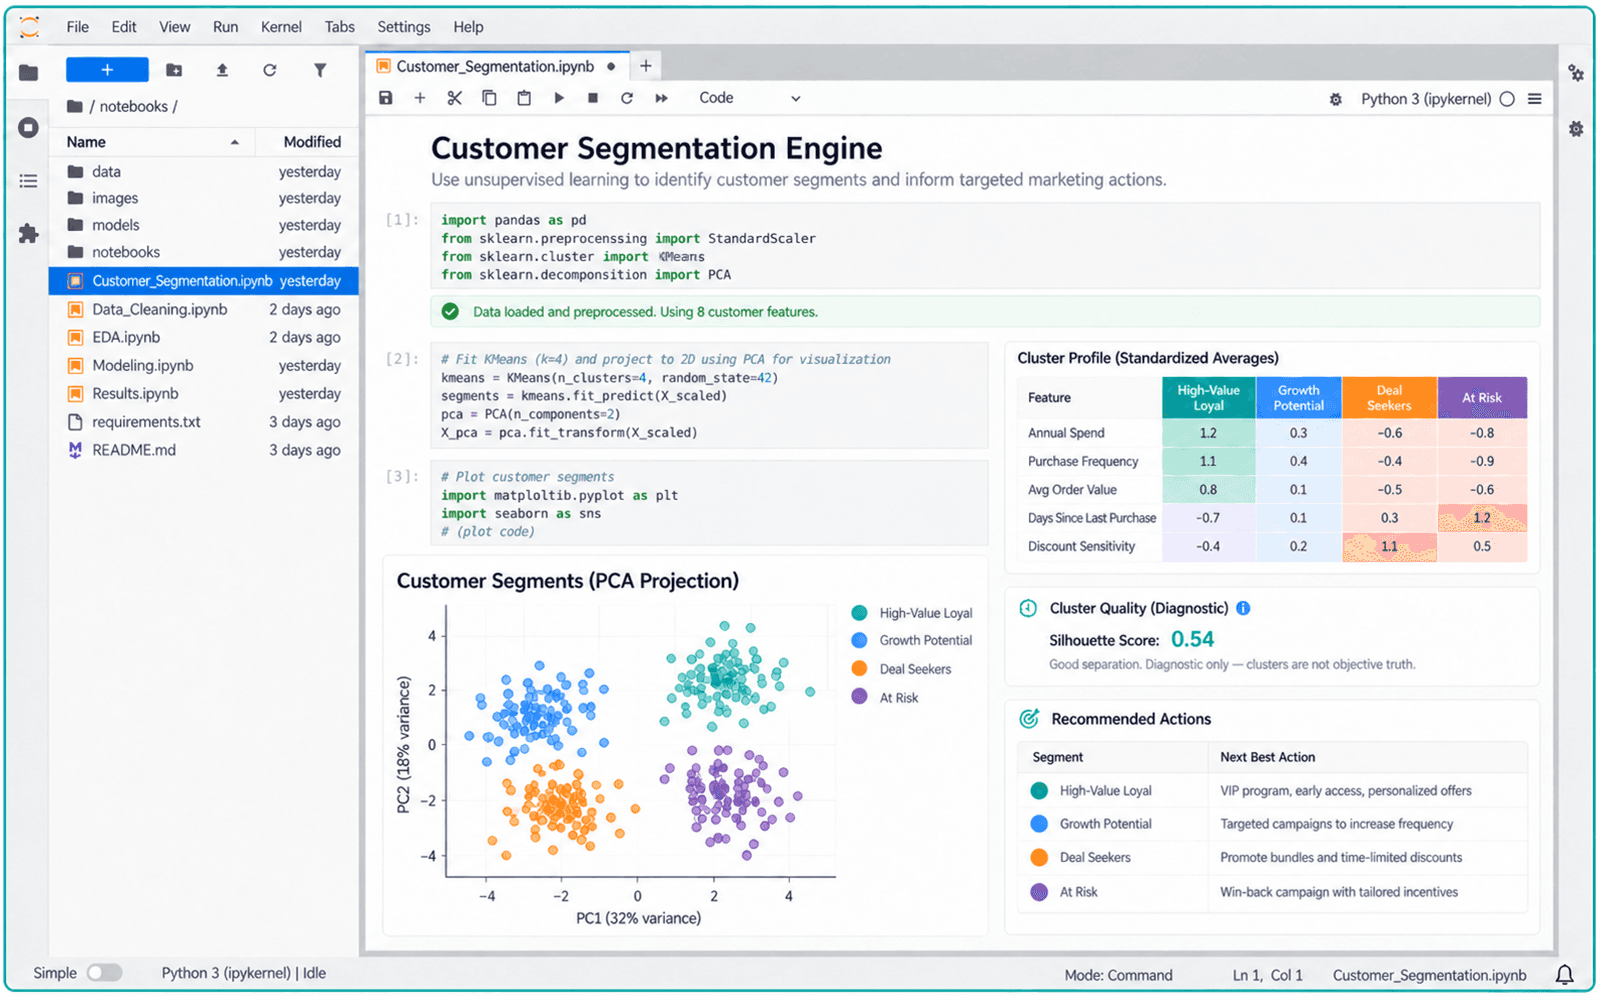
You leave with: Actionable segments tied to differentiated business treatment.
Illustrative project output. Interfaces and platform versions may change.
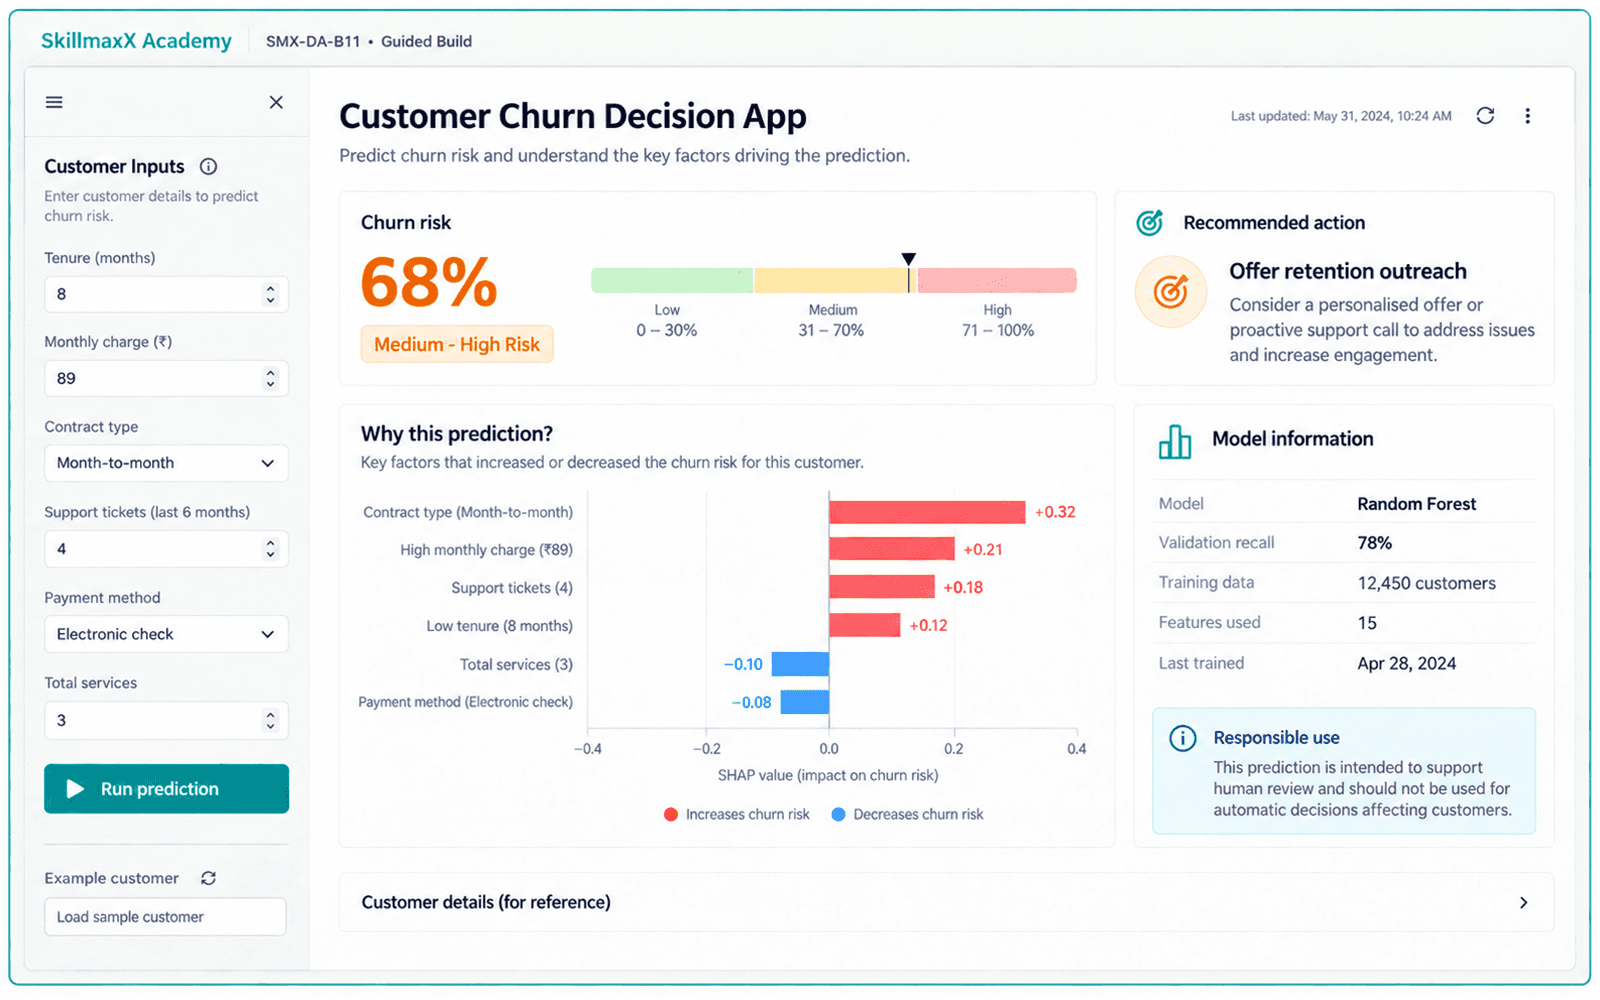
You leave with: A small usable ML application rather than an isolated notebook.
Illustrative project output. Interfaces and platform versions may change.
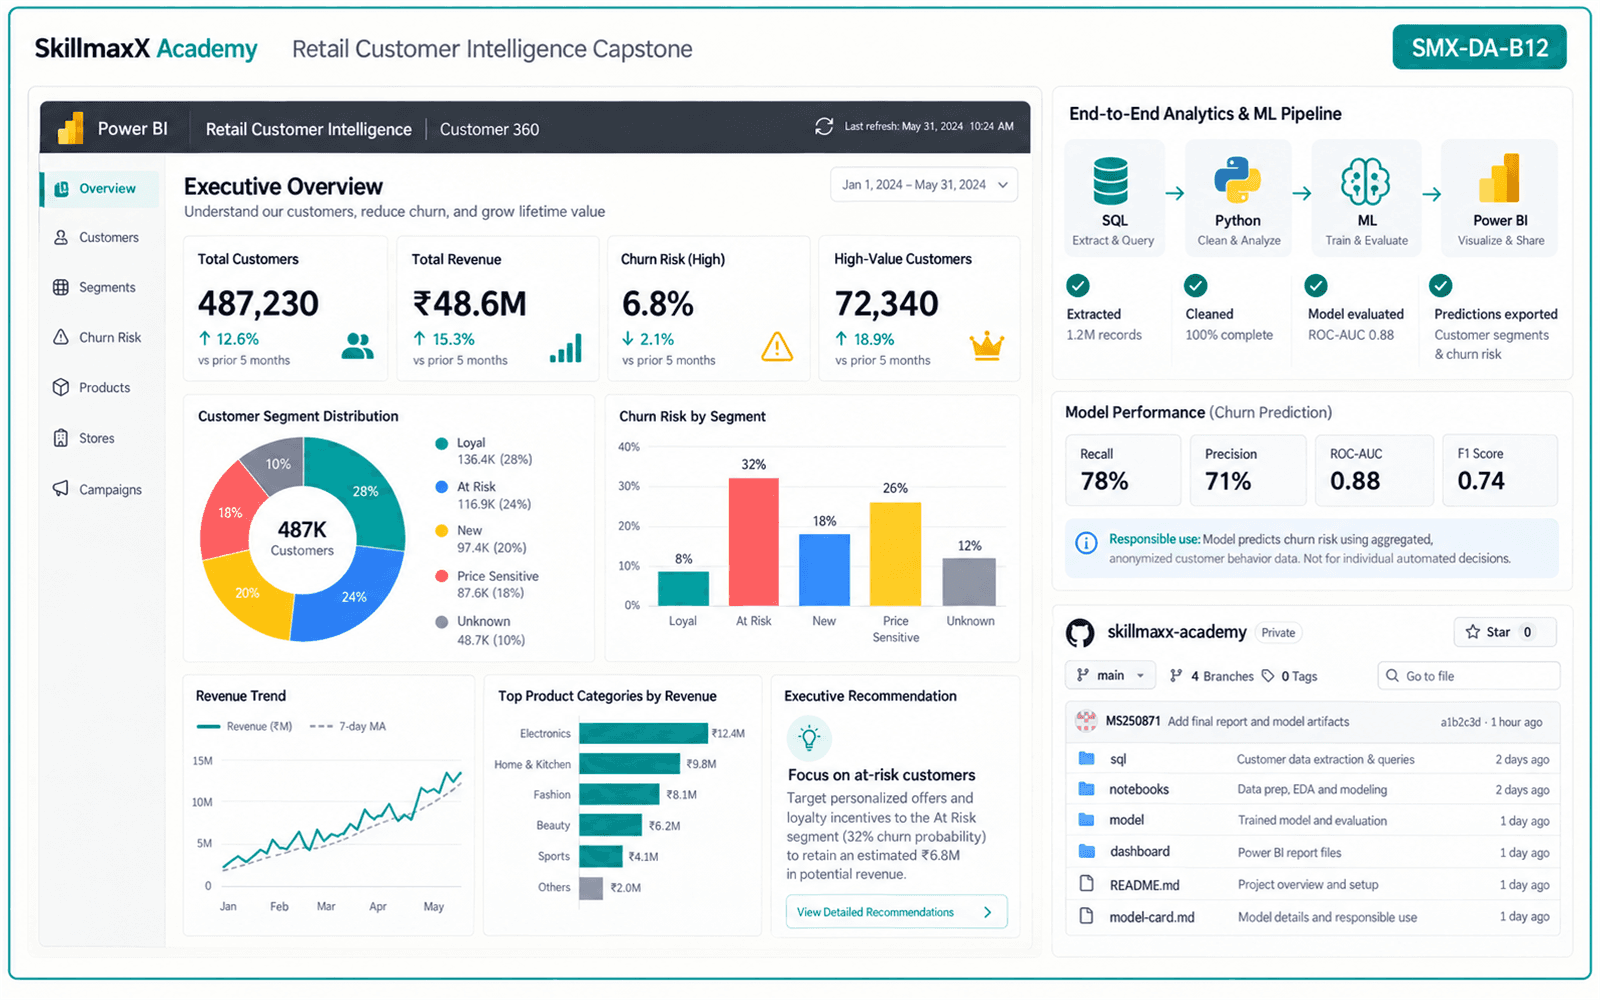
You leave with: An end-to-end portfolio capstone from raw data to executive recommendation.
Illustrative project output. Interfaces and platform versions may change.
Your learning platform
Live classes end. Your learning workspace remains available.
Review analytics, statistics, ML and BI through recordings, datasets, starter notebooks, SQL files, dashboard assets, model-evaluation checklists, project briefs and LMS doubts support.
Course dashboard
See your course, live sessions and learning access in one place.
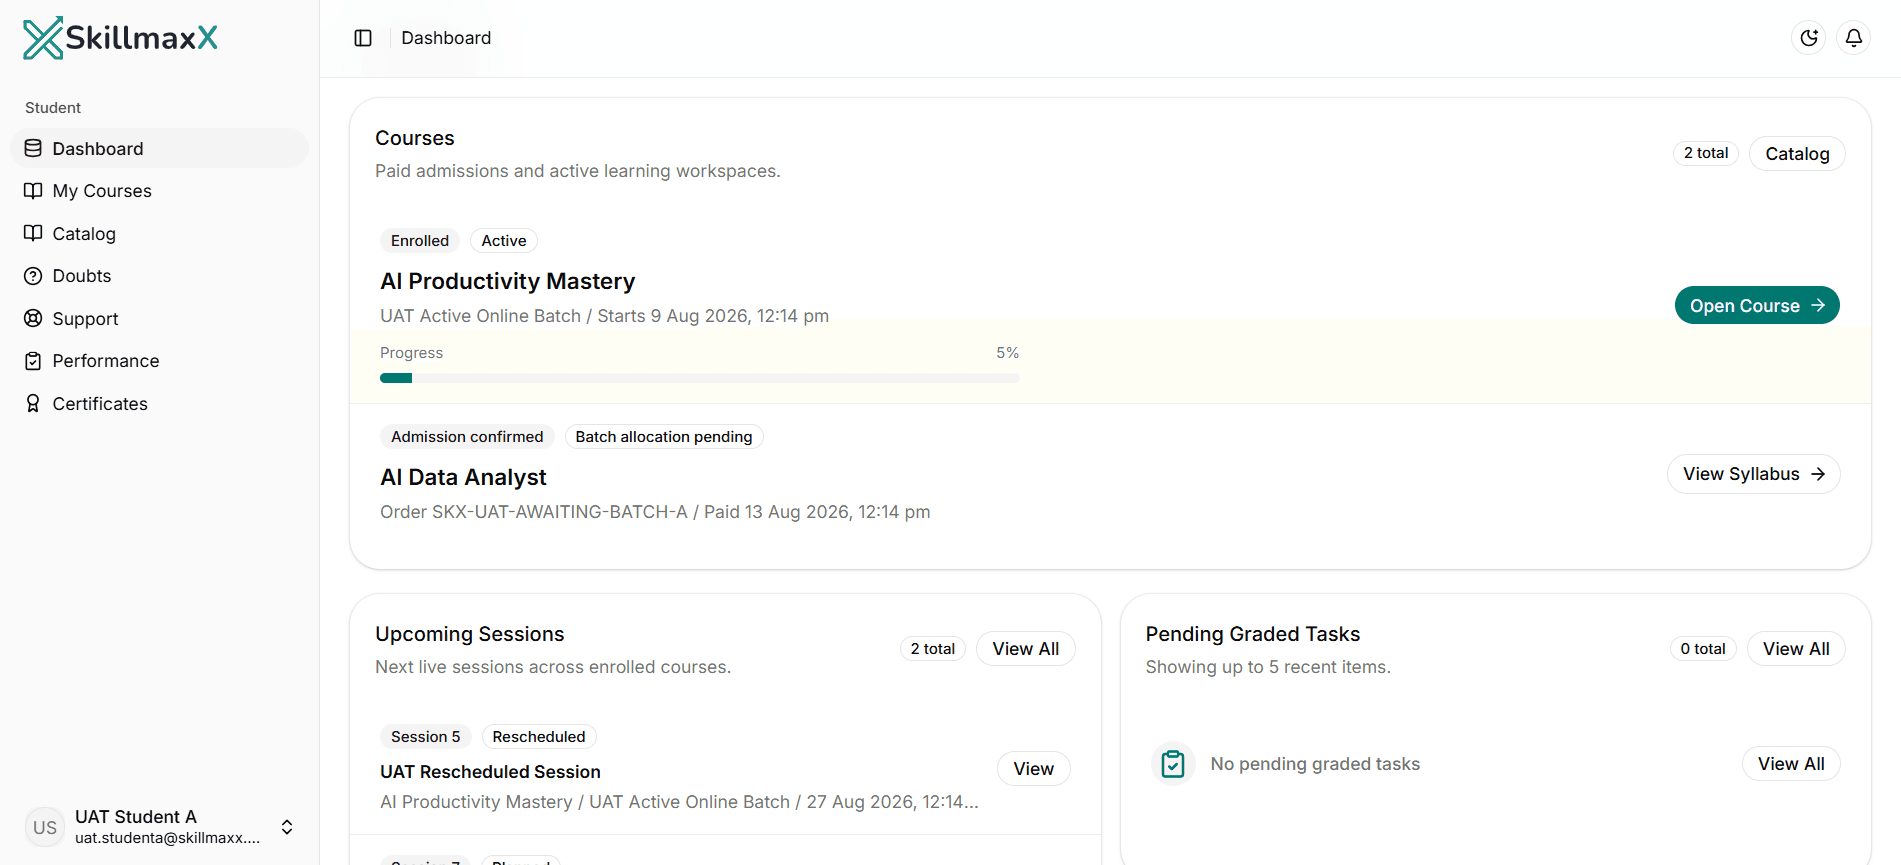
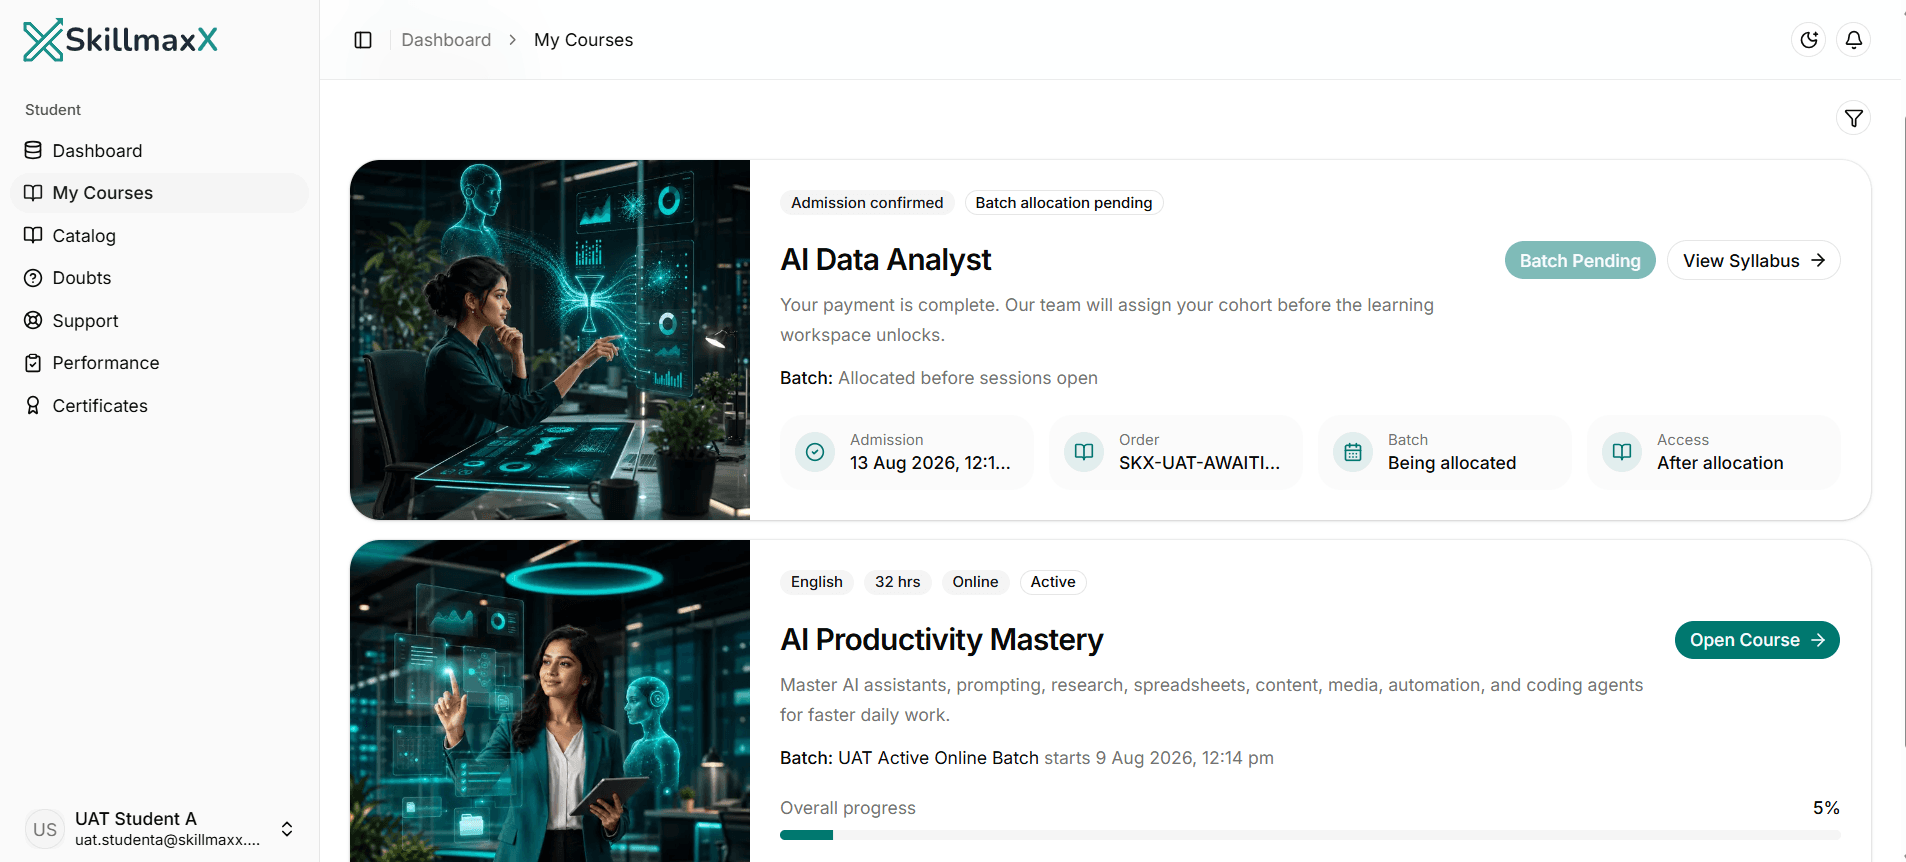
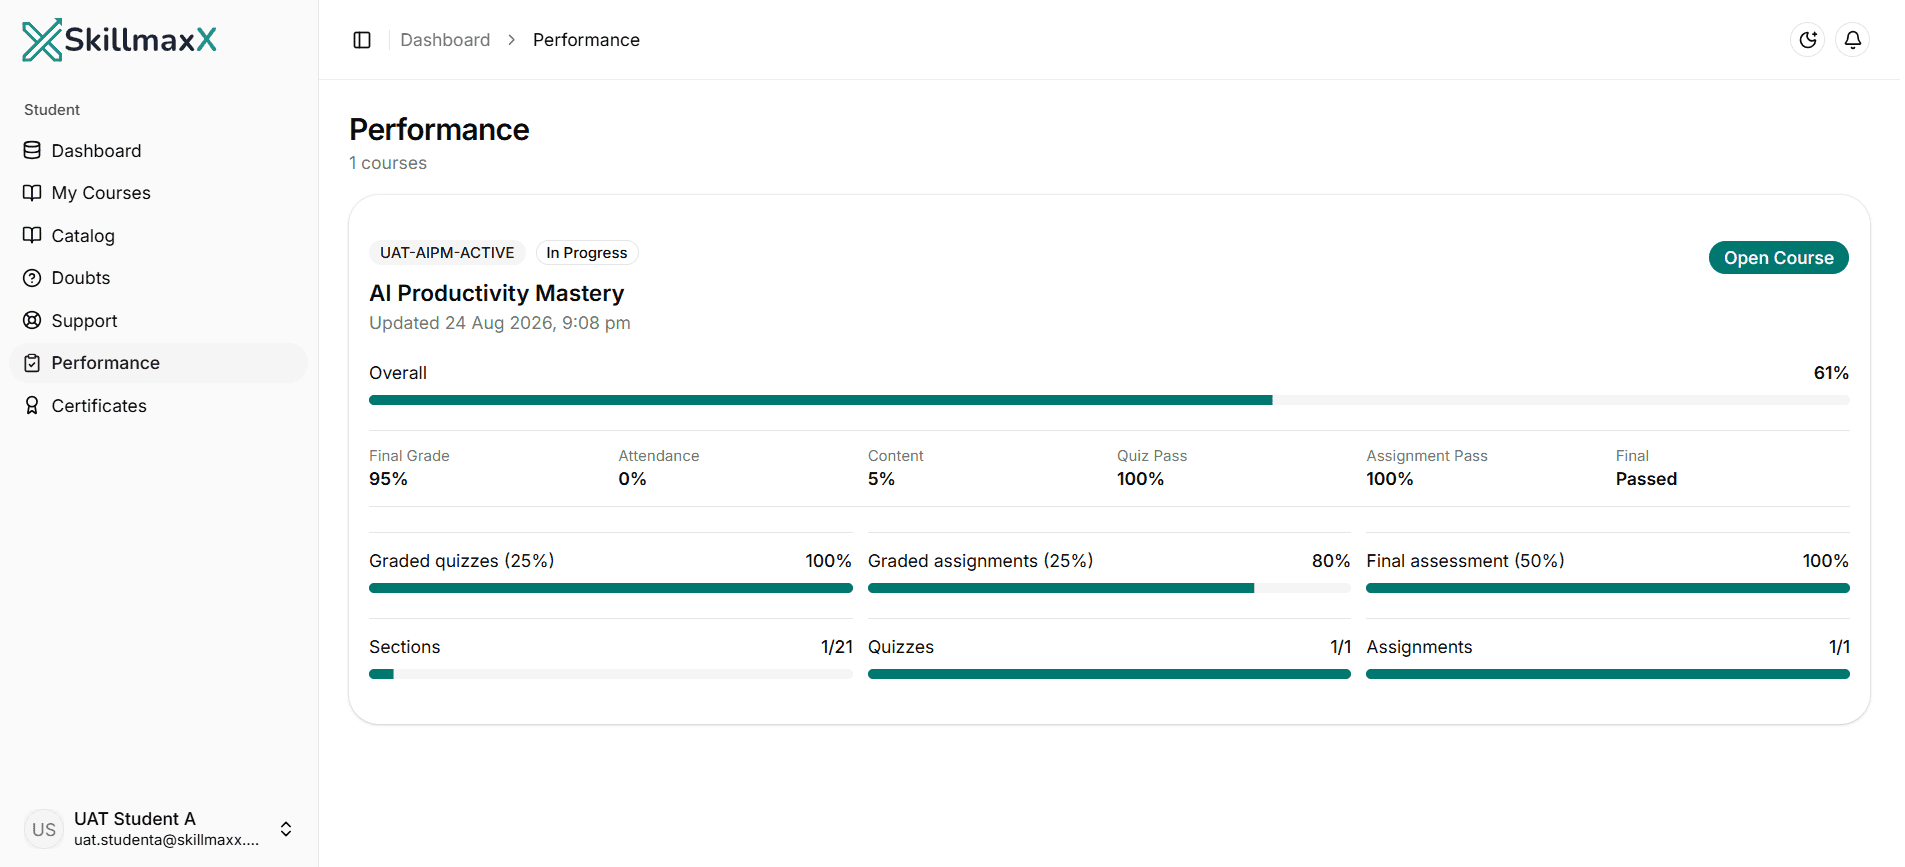
Live + LMS
How your learning works

Your instructor
Connect analytical tools, predictive models and business judgment
Munir Suri
Founder & Lead Instructor - SkillmaxX Academy
Engineer | IIM Kozhikode alumnus | Former Director, A.T. Kearney | Full Stack Development, IIT Madras | Digital Marketing, ISB Hyderabad
Munir Suri brings together management education, technology capability and transformation experience. His teaching connects analytical and predictive methods with the questions managers and operating teams actually need to answer.
Live sessions focus on reasoning, validation, model evaluation and communication as well as tool use, so learners can explain how a conclusion or prediction was reached and where its limitations lie.
Munir leads the analytics workflow, AI-assistance, applied-ML and portfolio sessions, supported by the structured LMS learning path.
Structured progression
Detailed 80-hour curriculum
Move from AI and spreadsheet foundations through Python, applied statistics, SQL, business intelligence, practical machine learning and portfolio publishing. 315 structured learning units are included.
Phase 1 · AI-assisted analytics foundations · 6 hours
Phase 2 · Spreadsheet analysis and data preparation · 9 hours
Phase 3 · Python for data analysis · 9.5 hours
Phase 4 · Applied statistics for analytics and ML · 10 hours
Phase 5 · SQL and databases · 10 hours
Phase 6 · Applied machine learning · 16.5 hours
Phase 7 · BI and modern analytics · 15.5 hours
Phase 8 · Portfolio and career projects · 3.5 hours
Analytics + applied-ML stack
Learn the workflow from raw data to prediction and decision
Core platforms receive hands-on use. AI assistants support question framing, coding, debugging and documentation, but learners remain responsible for validation, evaluation and judgment.
Core hands-on stack
Additional tools and awareness
AI assistance
ML extensions
AI spreadsheet self-study
Cloud analytics awareness
Platform interfaces and model libraries change. The programme preserves the analysis, evaluation and communication outcomes while updating specific tool steps when required.
A complete programme
What your course fee includes
Requirements and costs
Prepare for consistent hands-on practice
Basic comfort with spreadsheets, files, folders and internet-based tools.
A Windows-capable laptop that can run Excel, Power BI Desktop, Python/Jupyter and Streamlit workflows.
No prior Python, SQL or ML experience is required.
Comfort with school-level mathematics, percentages, charts and structured problem-solving is expected; the required applied statistics and model intuition are taught in the programme.
Plan six to eight hours of practice per week during the Python, SQL and ML phases.
Course completion
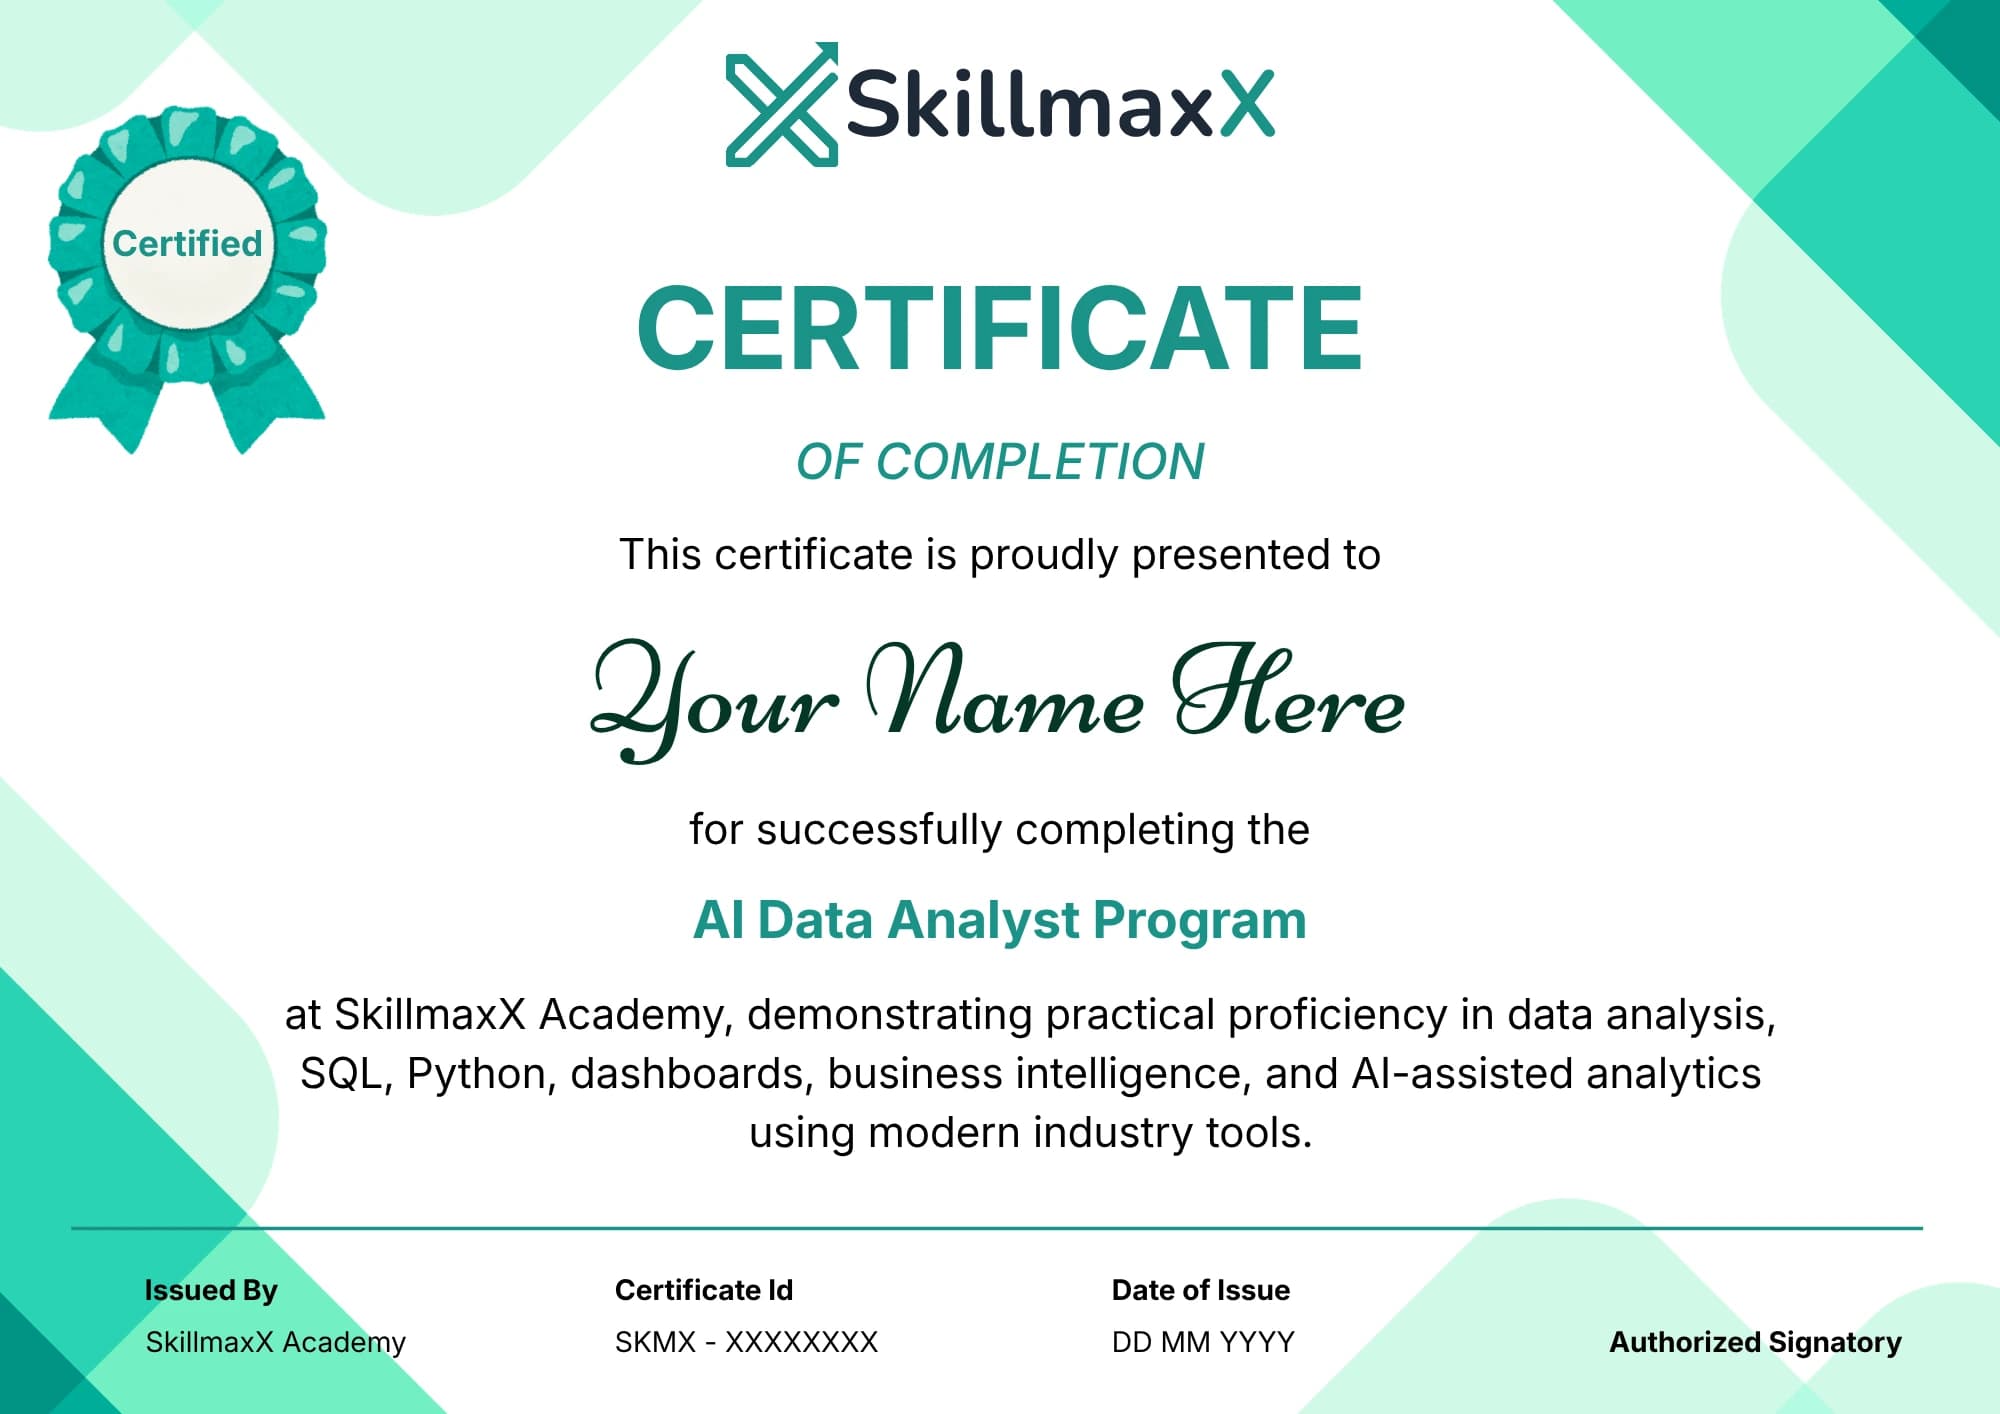
SkillmaxX completion certificate
Complete the published learning, practical work and course requirements to receive a SkillmaxX Academy completion certificate.
The certificate records completion of the programme. Your guided builds and documented project work provide the practical evidence behind it.
Course fee
Invest in job-ready analytics capability
Course fee
₹35,999
inclusive of GST
MRP ₹59,999
You save ₹24,000 (40% off)EMI starting from ₹4,000/month. Eligibility and terms apply.
Your fee includes approximately 80 live hours, 12 guided builds, recordings, approximately one year of LMS access, datasets and starter files, LMS doubts support, profile assessment, resume and portfolio guidance, interview preparation and a completion certificate for eligible learners.
EMI options may be available for eligible learners. No payment is required to request a course guidance call.
Live online and Gurgaon classroom formats are available. Your preferred mode and batch will be confirmed with you after admission.
Questions before joining
Frequently asked questions
Prepare to compete for your next data role
Build the practical skills, employer-facing portfolio and interview story to pursue opportunities across analytics, BI and applied machine learning.
80 live hours · 12 portfolio builds · Structured career preparation